Unlocking the Potential of Business Data Visualization: A Comprehensive Guide to Transforming Chaos into Clarity
Business data is often compared to oil—a precious resource that drives businesses forward. However, just like crude oil, raw data holds little value unless it undergoes refining and processing. This is where the significance of business data visualization emerges, acting as the refinery that transforms raw data into actionable insights.
The Overwhelming World of Data
Every day, businesses generate and receive vast amounts of data. From customer interactions and sales figures to website traffic and social media engagement, the influx is ceaseless.
A report by IDC suggests that by 2025, the global data sphere will grow to 175 zettabytes.
With such an overwhelming amount of data, the challenge isn't just collection but comprehension.
The Fragmentation Challenge
The modern business ecosystem is characterized by multiple touchpoints. Data pours in from various sources—CRM systems, ERP solutions, digital marketing platforms, and more. This leads to a fragmented data landscape.
As per recent statistics, a staggering 68% of businesses admit to struggling with data fragmentation.
This fragmentation hinders clear decision-making, with vital insights often lost in the deluge.
What is Business Data Visualization?
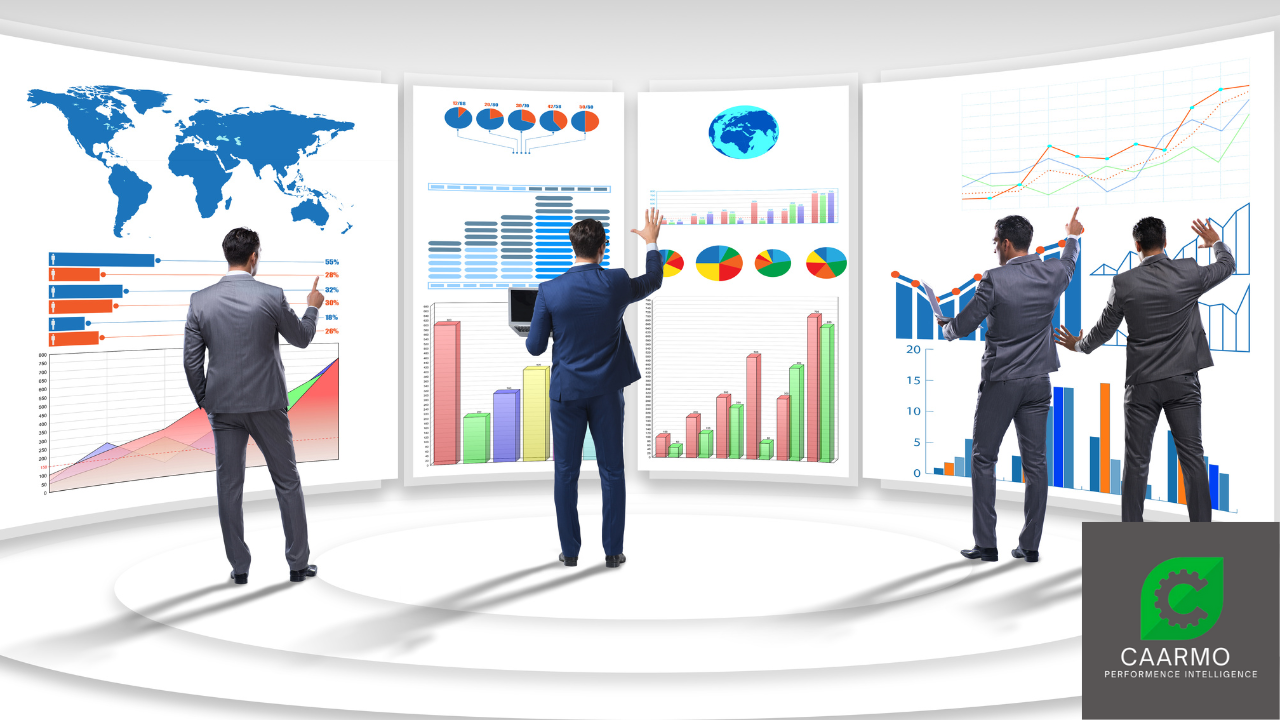
Business data visualization is the use of visual representations of data to communicate information to business users. It is a powerful tool that can be used to improve decision-making, identify trends, and communicate complex ideas.
Data visualization can be used to represent data in a variety of ways, including charts, graphs, maps, and infographics. The specific type of visualization that is used will depend on the type of data being represented and the audience that is being targeted.
The Tangible Benefits of Data Visualization
Humans are visual creatures. Studies suggest that the human brain processes visual information 60,000 times faster than text. Business data visualization leverages this innate human trait. By presenting data in a visual format, be it charts, graphs, or heat maps, businesses can quickly discern patterns, trends, and anomalies. Here are few specific benefits
- Improved decision-making: Data visualization can help businesses make better decisions by providing them with a clear and concise way to understand their data. By presenting data in a visual format, businesses can quickly identify trends, patterns, and outliers that might not be apparent in the raw data. This information can then be used to make more informed decisions about the business.
- Increased engagement: Data visualization can help businesses engage stakeholders with their data by making it more visually appealing and easier to understand. This is especially important for businesses that need to communicate complex data to a non-technical audience.
- Enhanced communication: Data visualization can help businesses communicate their data to stakeholders in a more effective way. By using visuals, businesses can tell a story with their data that is more likely to be remembered and understood.
- Improved problem-solving: Data visualization can help businesses identify and solve problems more quickly and easily. By visualizing data, businesses can see patterns and trends that might not be apparent in the raw data. This information can then be used to develop solutions to problems.
- Increased productivity: Data visualization can help businesses improve their productivity by automating tasks and making it easier to find information. For example, data visualization can be used to create dashboards that provide a real-time overview of key metrics. This information can then be used to make decisions and take action without having to manually track data.
Overall, business data visualization is a powerful tool that can be used to improve decision-making, increase engagement, enhance communication, improve problem-solving, and increase productivity.

CAARMO: Leading the Data Visualization Revolution
In the quest for effective data visualization solutions, CAARMO emerges as a frontrunner. Here's a deep dive into how CAARMO is reshaping the business data landscape:
Integration of Disparate Data Sources:
CAARMO's platform is adept at integrating data from diverse sources. Whether it's sales data from a CRM or engagement metrics from a social media platform, CAARMO brings it all together, offering a unified view.
Real-Time Data Visualization
In the dynamic world of business, real-time insights are invaluable. CAARMO's real-time visualization tools ensure that businesses are always a step ahead, armed with the latest data insights.
Empathy Graphs and Comparative Analysis
CAARMO's unique empathy graphs offer a visual snapshot of a business's current challenges. By juxtaposing these with industry benchmarks, businesses can gauge their performance and strategize accordingly.
Customization and Scalability
Every business is unique, with distinct data needs. CAARMO recognizes this and offers a platform that's both customizable and scalable. Whether you're a budding startup or a multinational corporation, CAARMO aligns with your data goals.
The Road Ahead
The future of business data visualization looks promising. As technology evolves, we can expect even more sophisticated visualization tools, powered by artificial intelligence and machine learning. These tools will offer predictive insights, enabling businesses to forecast trends and strategize proactively.
Moreover, as businesses recognize the value of data democratization, visualization tools will become ubiquitous, not just limited to analysts or top-tier management. Every department, from marketing and sales to HR and operations, will leverage these tools, fostering a data-driven organizational culture.
Final Thoughts
In the vast ocean of data, visualization is the lighthouse guiding businesses. It transforms the abstract into the tangible, the complex into the comprehensible. For businesses aiming to thrive in the data-driven era, tools like CAARMO are not just beneficial; they're indispensable.
In the words of Edward Tufte, a pioneer in the field of data visualization, "There is no such thing as information overload, just bad design." With effective business data visualization, businesses can ensure that their data design is not just good but exemplary.
Ready to transform your data chaos into actionable insights? Don't let fragmented data hold your business back. Take the first step towards a data-driven future with CAARMO. 
